About POGO
- Introduction
- Current Version
- Genome Pairwise Metrics
- Example: Comparison Between Two Species
- Example: Comparison Within A Single Species
- Example: All vs All
Introduction
A major aim of metagenomic studies is to identify and compare the phylogenetic composition of different samples. This task is usually accomplished by the use of marker genes that are globally conserved across prokaryotes, such as the 16S rRNA gene. Therefore, the choice of markers can greatly affect the results of studies, as different marker genes evolve at different rates and may represent better or worse the phylogenetic relationships of different prokaryotic lineages.
Database of Pairwise-comparisons Of Genomes and universal Orthologous genes (POGO-DB) provides a tool for users to probe questions regarding how different aspects of genome variation relate to each other, and to choose marker genes that will better fit the aims of specific studies in a more informed way.
Based on computationally intensive whole-genome BLASTs, POGO-DB provides several metrics on pairwise genome:
- Average Amino Acid Identity of all bi-directional best blast hits that covered at least 70% of the sequence and had 30% sequence identity.
- Genomic Fluidity that estimates the similarity in gene content between two genomes.
- Number of orthologs shared between two genomes (as defined by two criteria).
- Pairwise identity of the most similar 16S rRNA genes.
- Pairwise identity of 73 additional globally-conserved marker genes (which were determined by us to exist in at least 90% of all the genomes).
- Query and download the pairwise metrics between selected prokaryote genomes, species and genera.
- Visualize and download the result metrics against each other in a 2-D plot for exploratory analysis of how different genomes and universal gene markers relate to each other within a taxonomic group.
- Download pairwise genome BLAST files that were computed.
- Access the pairwise orthologous sequences from NCBI's database via accession number and gene locations
Current Version
The current release of POGO-DB is based on genomes of 2,013 bacteria strains from the NCBI database (in July, 2012). Genes annotated as “16S rRNA gene” were extracted from each strain. There were a total of 1,897 genomes with 16S rRNA genes of legitimate length (1000bp to 1800bp nucleotides). We conducted bi-directional BLAST (blastp) between all annotated CDS for each pair of genomes whose maximum 16S rRNA percent identity are above 80% according to Needleman-Wunsch alignment. To view the maximum 16S rRNA identity between all pairs of genomes, please download POGODB_16S_rRNA_identity.csv.bz2
In strain Escherichia coli K12 W3110 (uid161931), we acquired 79 genes that are annotated as single copy genes universal to all genomes in the COG database. Using these gene sequences as reference, we conduct BLAST search (tblastn + tblastx) to identify these marker genes in each of the 1,897 genomes. We maintain 73 marker genes in our analysis that are present in over 90% of the genomes, and altogether there are 1204 strains that contain all 73 marker genes in their genomes.
Genome Pairwise Metrics
Orthologs (criterion1): For each bi-directional BLAST search between two genomes, orthologs (criterion1) are determined as the best reciprocal hits that covered at least 70% of the sequence and had 30% sequence identity according to BLAST alignment. This is the same criterion used by Konstantinidis and Tiedje
Average amino acid percent identity (AAI): Smith-Waterman alignment is performed for all orthologs (as defined by criterion1) between two genomes to acquire the average amino acid percent identity. The average AAI serves as a metric for the general genomic similarity. Only genome pairs with at least 200 orthologs (criterion1) are computed for the average AAI, therefore, 2,556 out of 717,861 pairs of genomes we analyzed do not have this metric.
Orthologs (criterion2): For each bi-directional BLAST search between two genomes, orthologs (criterion2) are determined as the best reciprocal hits that covered at least 50% of the sequence and had 10% sequence identity according to BLAST alignment.
Genomic fluidity: Genomic fluidity measures the percentage of genes shared by two genomes. It is calculated as the ratio of the number of unique genes in two genomes over the total number of genes in them: Genomic Fluidity(i,j)=(Unique_i+Unique_j)/(Total_i+Total_j ). To be strict in determining if a gene is unique to a genome, we applied a loosened criterion (as defined by criterion2) for defining orthologs between two genomes. Only genome pairs with at least 200 orthologs (criterion2) are computed for the genomic fluidity, therefore, 1,882 out of 717,861 pairs of genomes we analyzed do not have this metric.
16S rRNA percent identity: All 16S rRNA genes are aligned pairwisely using Needleman-Wunsch algorithm. Since the 16S rRNA gene has multiple copies in about 80% of the genomes, we use the maximum 16S rRNA similarity between genomes to represent their 16S rRNA percent identity. Other marker genes: In addition to the widely used 16S rRNA gene, we identified 73 single copy genes that are universal to prokaryotes. Each marker gene is present in more than 90% of the genomes. Similar to the 16S rRNA gene, all nucleotide sequences are aligned pairwisely using Needleman-Wunsch algorithm and the percent identity are provided for each marker gene. The names and symbols of the marker genes are:
| Gene Symbol | COG ID | Description |
|---|---|---|
| ArgS | COG0018 | Arginyl-tRNA synthetase |
| CdsA | COG0575 | CDP-diglyceride synthetase |
| CoaE | COG0237 | Dephospho-CoA kinase |
| CpsG | COG1109 | Phosphomannomutase |
| DnaN | COG0592 | DNA polymerase sliding clamp subunit (PCNA homolog) |
| Efp | COG0231 | Translation elongation factor P/translation initiation factor eIF-5A |
| Exo | COG0258 | 5-3 exonuclease (including N-terminal domain of PolI) |
| Ffh | COG0541 | Signal recognition particle GTPase |
| FtsY | COG0552 | Signal recognition particle GTPase |
| FusA | COG0480 | Translation elongation and release factors (GTPases) |
| GlnS | COG0008 | Glutamyl- and glutaminyl-tRNA synthetases |
| GlyA | COG0112 | Glycine hydroxymethyltransferase |
| GroL | COG0459 | Chaperonin GroEL (HSP60 family) |
| HisS | COG0124 | Histidyl-tRNA synthetase |
| IleS | COG0060 | Isoleucyl-tRNA synthetase |
| InfA | COG0361 | Translation initiation factor IF-1 |
| InfB | COG0532 | Translation initiation factor 2 (GTPase) |
| KsgA | COG0030 | Dimethyladenosine transferase (rRNA methylation) |
| LeuS | COG0495 | Leucyl-tRNA synthetase |
| Map | COG0024 | Methionine aminopeptidase |
| MetG | COG0143 | Methionyl-tRNA synthetase |
| NrdA | COG0209 | Ribonucleotide reductase alpha subunit |
| NusG | COG0250 | Transcription antiterminator |
| PepP | COG0006 | Xaa-Pro aminopeptidase |
| PheS | COG0016 | Phenylalanyl-tRNA synthetase alpha subunit |
| PheT | COG0072 | Phenylalanyl-tRNA synthetase beta subunit |
| ProS | COG0442 | Prolyl-tRNA synthetase |
| PyrG | COG0504 | CTP synthase (UTP-ammonia lyase) |
| RecA | COG0468 | RecA/RadA recombinase |
| RplA | COG0081 | Ribosomal protein L1 |
| RplB | COG0090 | Ribosomal protein L2 |
| RplC | COG0087 | Ribosomal protein L3 |
| RplD | COG0088 | Ribosomal protein L4 |
| RplE | COG0094 | Ribosomal protein L5 |
| RplF | COG0097 | Ribosomal protein L6 |
| RplJ | COG0244 | Ribosomal protein L10 |
| RplK | COG0080 | Ribosomal protein L11 |
| RplM | COG0102 | Ribosomal protein L13 |
| RplN | COG0093 | Ribosomal protein L14 |
| RplP | COG0197 | Ribosomal protein L16/L10E |
| RplR | COG0256 | Ribosomal protein L18 |
| RplV | COG0091 | Ribosomal protein L22 |
| RplX | COG0198 | Ribosomal protein L24 |
| RpoA | COG0202 | DNA-directed RNA polymerase alpha subunit/40 kD subunit |
| RpoB | COG0085 | DNA-directed RNA polymerase beta subunit/140 kD subunit |
| RpoC | COG0086 | DNA-directed RNA polymerase beta subunit/160 kD subunit |
| RpsB | COG0052 | Ribosomal protein S2 |
| RpsC | COG0092 | Ribosomal protein S3 |
| RpsD | COG0522 | Ribosomal protein S4 and related proteins |
| RpsE | COG0098 | Ribosomal protein S5 |
| RpsG | COG0049 | Ribosomal protein S7 |
| RpsH | COG0096 | Ribosomal protein S8 |
| RpsI | COG0103 | Ribosomal protein S9 |
| RpsJ | COG0051 | Ribosomal protein S10 |
| RpsK | COG0100 | Ribosomal protein S11 |
| RpsL | COG0048 | Ribosomal protein S12 |
| RpsM | COG0099 | Ribosomal protein S13 |
| RpsN | COG0199 | Ribosomal protein S14 |
| RpsO | COG0184 | Ribosomal protein S15P/S13E |
| RpsQ | COG0186 | Ribosomal protein S17 |
| RpsS | COG0185 | Ribosomal protein S19 |
| SecY | COG0201 | Preprotein translocase subunit SecY |
| SerS | COG0172 | Seryl-tRNA synthetase |
| ThrS | COG0441 | Threonyl-tRNA synthetase |
| Tmk | COG0125 | Thymidylate kinase |
| TopA | COG0550 | Topoisomerase IA |
| TrpS | COG0180 | Tryptophanyl-tRNA synthetase |
| TruB | COG0130 | Pseudouridine synthase |
| TrxA | COG0526 | Thiol-disulfide isomerase and thioredoxins |
| TrxB | COG0492 | Thioredoxin reductase |
| TufB | COG0050 | GTPases - translation elongation factors |
| TyrS | COG0162 | Tyrosyl-tRNA synthetase |
| ValS | COG0525 | Valyl-tRNA synthetase |
Average ranking of marker genes: We allow users to compare marker genes across genome pairs. For pairs with both genomes containing all 73 marker genes and the 16S rRNA gene, we rank the genes by their identities from 1 to 74. The rank represents the evolution rate of each gene relatively to each other between two genomes. We then take the average rank of each marker gene across all genome pairs. This is done for genome pairs in "A vs. A", "B vs. B" and "A vs. B" separately.
Example: Comparison Between Two Species
Users can select any number of genomes into both group A and group B, they can also add an entire species or genus at a time. For example, users can select species “Streptococcus equi” to add species to group A, and then select “Streptococcus pneumoniae” to add to group B.
By default, the database provides comparison between each genome in group A vs. each genome in group B, however, the users are free to choose whether they also want the comparisons within group A and within group B.

The result page presents a table, and each row of it represents a pair of genomes queried, as long as the two genomes have 80+% 16S rRNA gene identity. For each pair of genomes, several metrics are provided, including the average amino acid identity of the genomes, genomic fluidity, number of orthologs (as defined by two criteria), the 16S rRNA gene identity and the identity of other marker genes

In addition, a 2-D graph will be provided for the users, to plot any two metrics of the user’s choice (default graph is 16S rRNA identity vs. the average AAI). By choosing different metrics on the axis, users can visualize which marker gene better groups/separates the two selected groups of genomes.


In this case, for example, gene InfA provides tighter clustering of the genome groups, indicating that it is very conserved within in each species. Therefore, this gene is a good marker for differentiating the two species but cannot be used for differentiating the genomes within each species.

If the "Average Ranking" option is checked, an additional table will be provided showing the average rank of each marker gene across the queried pairs of genomes. Some of the pairs may not be included in this computation because the genomes do not have all 74 marker genes. Therefore, the number of pairs actually incorporated into the computation will be shown in the heading of the table.
Example: Comparison Within A Single Species
In addition to the comparison between two groups of genomes, we allow users to visualize the pairwise comparison of genomes in only one species, genus or a combination of genera selected by them. This can be done by adding the genomes of interest into only one group, for example, adding species “Bacillus cereus” to group A, and choose to compare A to itself.

In this example, we can see that the average amino acid identity ranges from 92-100%, and the 16S rRNA genes from the species are forming two groups. Noticeably, more similar 16S rRNA genes do not necessarily indicate higher average AAI, which is the similarity metric of two genomes over all their orthologs. Therefore, the 16S rRNA gene is not a good marker for this species

To the contrary, several other marker genes such as the RpoB gene provide a continuous and more correlated variation between the genomes, and hence can be a potentially better marker gene for this species.

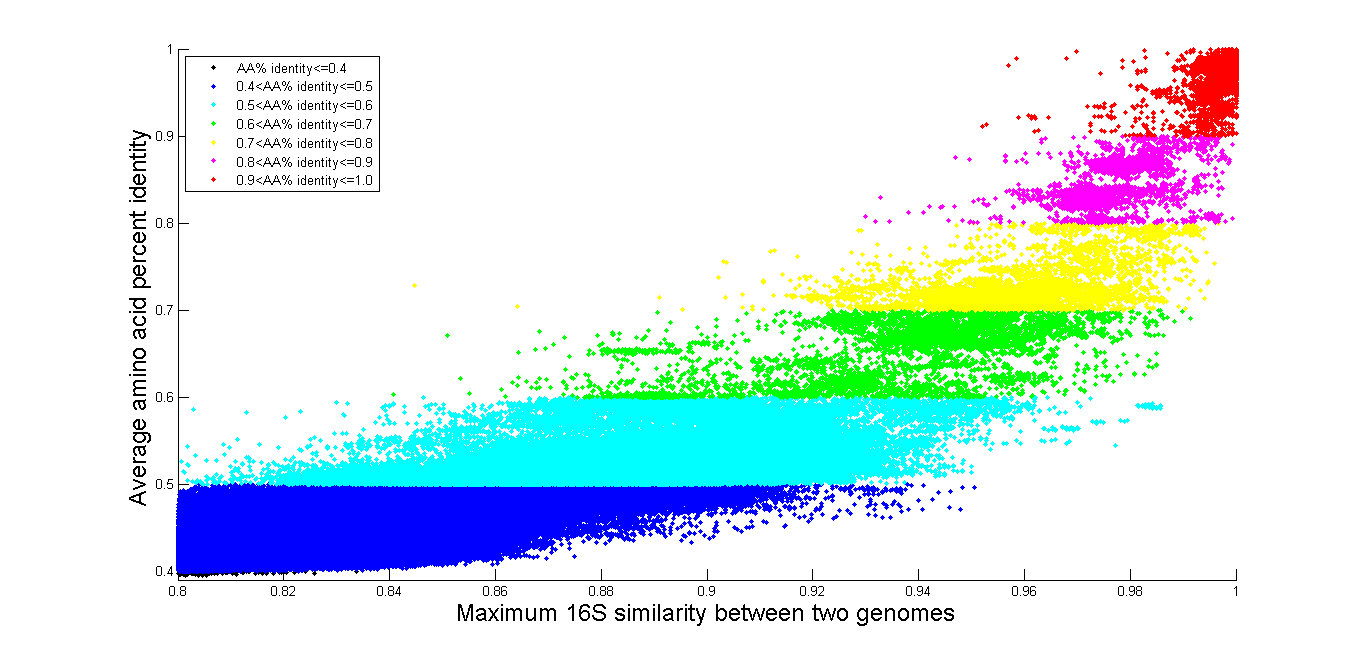
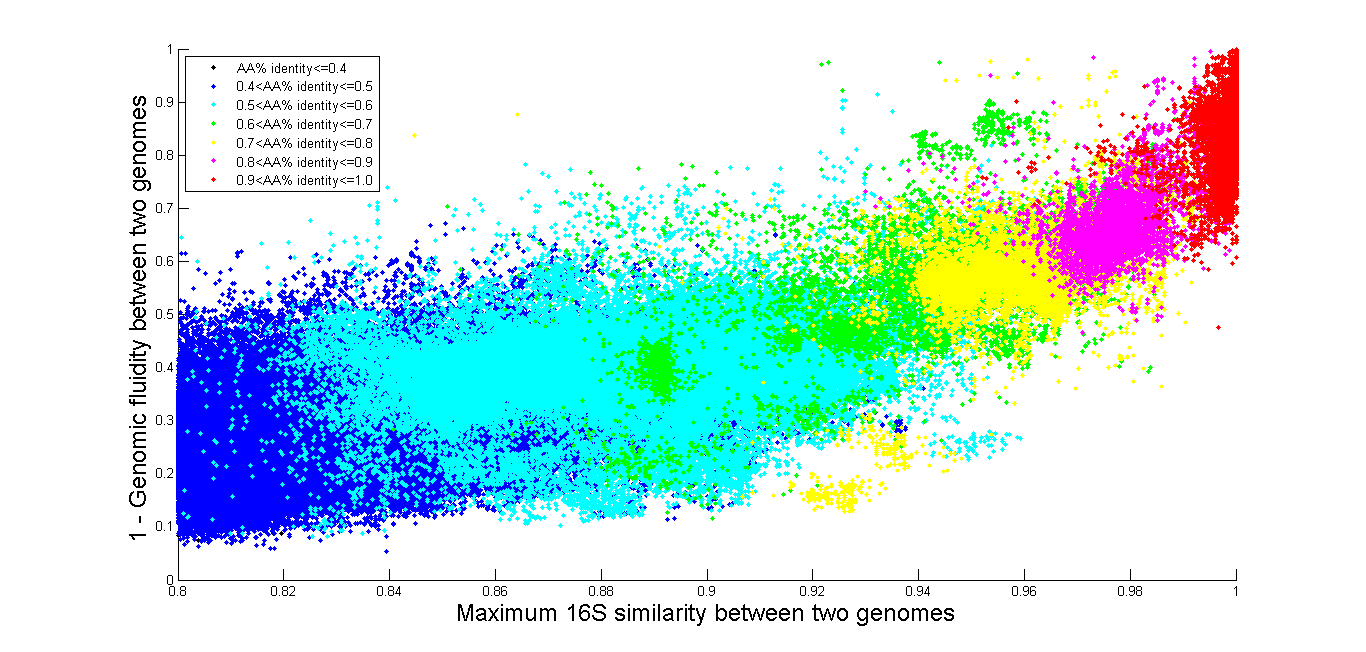
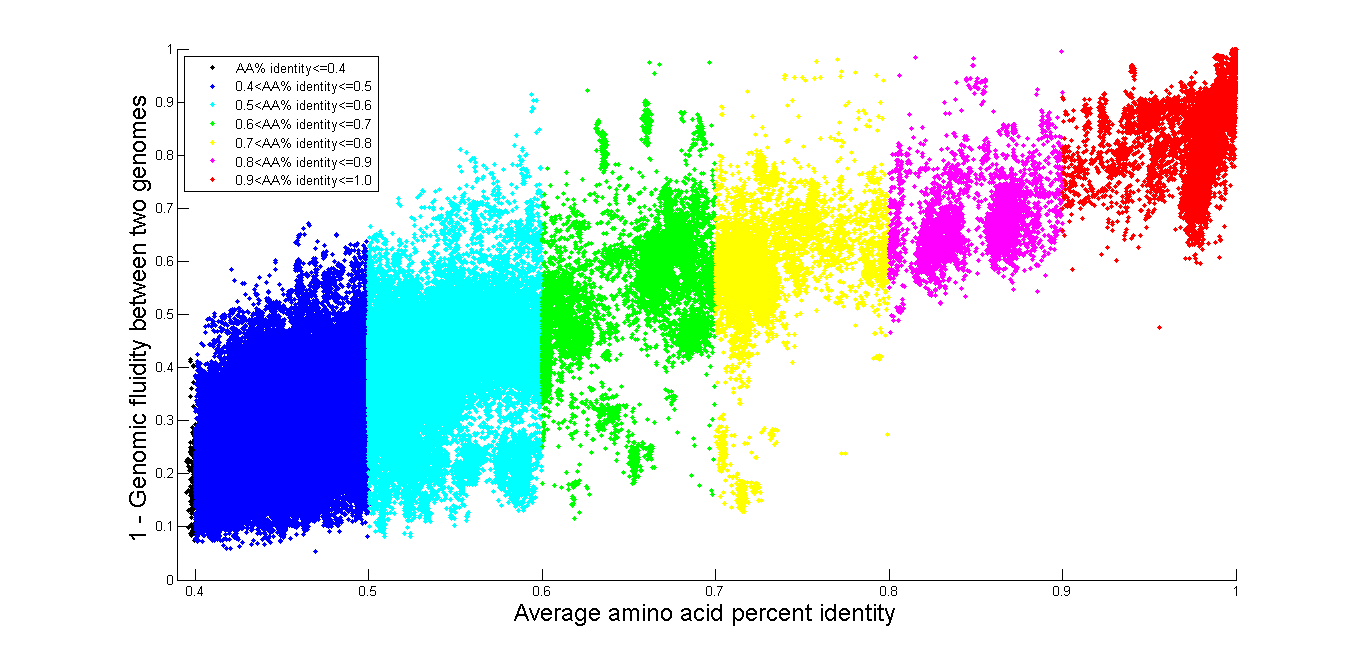
Example: All vs. All
The time it takes to query the database increases with the number of genome
comparisons requested, so if you are interested in comparing a large number of
genomes, we provide some precomputed results. On our Download page we have results of all marker genes, and
all genome pairs where 16S rRNA gene identity is above 80%, and also all 16S
rRNA gene identity for all comparisons even when they are below 80. Below we
also provide several graphs of All vs. All, which are also available on the
download page

 >
>


